Brownfield Engineering / Automation / AI-Augmented Development
Diagnose, Adapt & Enhance
Recovering Reliable Browser Validation in an Existing Application
CASE STUDY
An existing PHP, CSS, and JavaScript portfolio needed stronger browser-level evidence than implementation and deployment alone could provide. A dedicated Chrome debugging environment enabled a CDP harness that evolved through focus, render-readiness, and hit-testing adaptations. The retained run records defined checks, not universal correctness.
PHP
JavaScript
CSS
Chrome DevTools Protocol
Browser Automation
DOM
AI-Assisted Development
Validation
The problem
Four different states
Code changed. Deployment succeeded. The application appears to work. Defined application behavior has been validated. These are not equivalent states. The workflow needed observable checks at the browser boundary, not another implementation success message.
Brownfield, not a blank slate
Greenfield work allows architecture and implementation to be selected from the beginning. Brownfield work enters an existing system with behavior, dependencies, constraints, incomplete knowledge, and working and non-working parts. This work adapted the existing portfolio and validation path while preserving surrounding behavior. Neither pattern is superior; they require different engineering behaviors.
The development loop
A closed-loop development system
Map of the actual workflow; deployment was controlled, not an automatic CI/CD pipeline.
Human
Goals, context, constraints, and acceptance
Requirements
Explicit scope and expected behavior
AI coding agent
Exploration, implementation, and proposed adaptations
Local code
PHP / CSS / JavaScript
Controlled deployment
Selected files, isolated development target
Live application
Hosted application and its dependencies
Chrome runtime
Actual rendered and interactive behavior
CDP harness
Observation, input, and defined checks
Observable evidence
States, hashes, screenshots, and results
Human + AI iteration
Evaluate evidence and refine the next change
Observable evidence feeds the next requirements, test points, and implementation changes.
The observability gap
The required interactions were not reliable
The existing validation path was not reliably completing the required pointer interactions. Retained session accounts describe shared-browser click timeouts despite inspected DOM bounds, followed by successful DOM-level toggling. These accounts support the observation gap; they do not independently establish the precise cause of the original pointer failures.
A fallback is a different test point
Inspecting or toggling a DOM element can establish its state and native behavior, but does not by itself prove that a real pointer action reaches it. The next validation boundary needed to make input, focus, geometry, and the resulting state observable together.
Change the observation point
When the obvious path fails, change the observation point
The human supplied a dedicated Chrome debugging environment. Its localhost endpoint on port 9222 exposed Chrome DevTools Protocol. The useful change was the observation and control boundary: browser state, native input, focus, viewport emulation, console events, and resource events could be inspected together. The port number itself was not the solution.
Keep the boundary controlled
The harness attached to the existing debugging session and development application. It did not require a new application framework or a production-site migration. Private profile paths, launcher arguments, account details, and authentication material are excluded from this public case.
Iterative harness evolution
Explore iterative harness evolution
Three retained revisions
Order is supported by retained source history. Explanations of earlier runtime failures remain qualified.
Version 1
Initial input validation, including programmatic focus and Enter
Version 2
Temporary focus emulation, pointer focus, and native Space activation
Version 3
Font/load readiness, layout observation, and fresh hit-testing
Retained final run
Selected UI-state assertions, snapshots, and structured results
Focus adaptation: selected revision diff
Selected statements from the retained revisions; unrelated code is omitted. This shows the adaptation, not an independently proven cause of the earlier context loss.
The revision established pointer focus, checked the active element, and then exercised native keyboard behavior. Session accounts describe a context/focus failure; retained source directly proves what changed.
Render-readiness test point
An actual statement from the third retained harness revision.
The settling fingerprint also observed scroll position, viewport, document height, menu state, disclosures, comparison mode, and copy feedback. It used rendering frames and a short stable-state window, with bounded deadlines rather than an unlimited wait.
Fresh pointer hit-test
The DOM expression extracted from the retained Runtime.evaluate call. Selector interpolation is shown as a selector parameter; no private paths or identifiers are included.
JavaScript
const el = document.querySelector(selector);
const rect = el.getBoundingClientRect();
const x = rect.x + rect.width / 2;
const y = rect.y + rect.height / 2;
const hit = el.contains(document.elementFromPoint(x, y));
Coordinates were remeasured after mouse movement and checked against the element under the point before mouse press/release. Session accounts suggest shifted geometry; the exact original pointer-failure cause remains unproven.
A selected-state checkpoint
Actual hash construction from the retained harness; snapshot selection is defined by the test code.
Before/after hashes made state changes visible in the trace. A changed selected-state hash is not, by itself, a correctness assertion or a full-DOM integrity proof.
Test-point troubleshooting
Establish test points at system boundaries
As in electronics troubleshooting, an observable boundary is more useful than treating the entire system as one black box. This is the reasoning model used to investigate and adapt the workflow.
TROUBLESHOOTING MODEL / observed states and hypotheses remain distinct
Symptom
Required interaction is not reliably completing.
Expected behavior
Define the control action and the state that should follow.
Test point
Choose an interface that exposes the relevant boundary.
Observation
Inspect DOM state, focus, bounds, input, and events.
Hypothesis
Separate a proposed explanation from an established fact.
Experiment
Change one validation condition or control path.
Result
Compare the expected and observed transition.
Next test point
Move the observation boundary when evidence is insufficient.
Adaptation
Make the smallest defensible change to the workflow or harness.
Validation
Run defined checks and preserve their evidence.
Before / after engineering loop
Requirements outgrew the validation path
The earlier workflow was useful for implementation and deployment. Stronger interaction requirements called for additional observation and control.
Before: available validation path
Implement, deploy, then manually inspect or rely on an assumed behavior.
BEFORE / conceptual workflow summary
Implement
Deploy
Assume / manually inspect
Implementation notes & characteristics
This is a conceptual summary, not a complete recording of every earlier action.
Lower automation overhead
Runtime interaction evidence could be incomplete
After: instrumented validation loop
Observe runtime behavior, exercise input, check state, and feed evidence into the next correction.
AFTER / closed-loop validation model
Implement
Deploy
Observe
Interact
Measure
Validate
Correct
Correction feeds the next implementation and validation iteration.
Implementation notes & characteristics
The retained run demonstrates the defined checks. It does not establish behavior outside the exercised paths.
Repeatable checks and retained observations
Additional test code and environment maintenance
Difference
Defined browser actions and observable states supplement implementation and deployment.
Why it matters
Runtime behavior must be evaluated at the boundary where it occurs.
Trade-off
More instrumentation and harness maintenance in exchange for stronger evidence for the selected checks.
When to use each
Manual inspection remains useful for exploration. Repeatable interaction requirements benefit from automated state checks; neither replaces human acceptance.
Historical validation evidence
Historical monitored run
These results describe only the retained Layer 3 monitored validation run and the paths exercised during that run. They are not updated with the current Layer 4B regression results.
Passing checks
16
Changed snapshot hashes
15
Responsive viewports
4
Recorded console errors
0
Failed resources
0
Sanitized summary of the retained report; source file timestamp 2026-10-07 19:07:33 UTC.
Snapshot hashes represent selected UI-state snapshots, not full-DOM integrity or universal correctness. Zero recorded errors applies to this monitored run and its exercised paths.
Responsive evidence
Rendered appearance is one evidence type
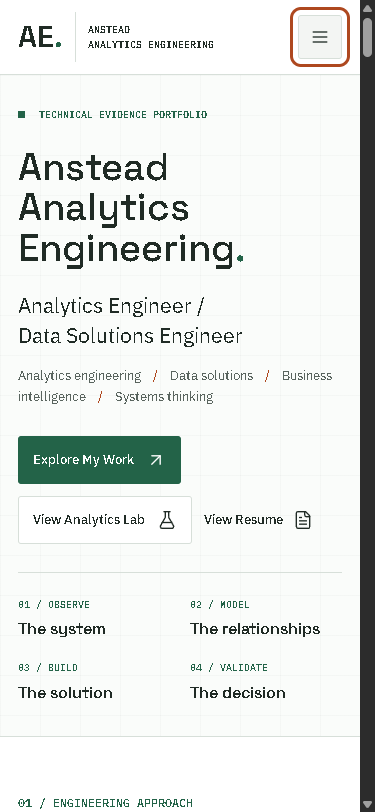
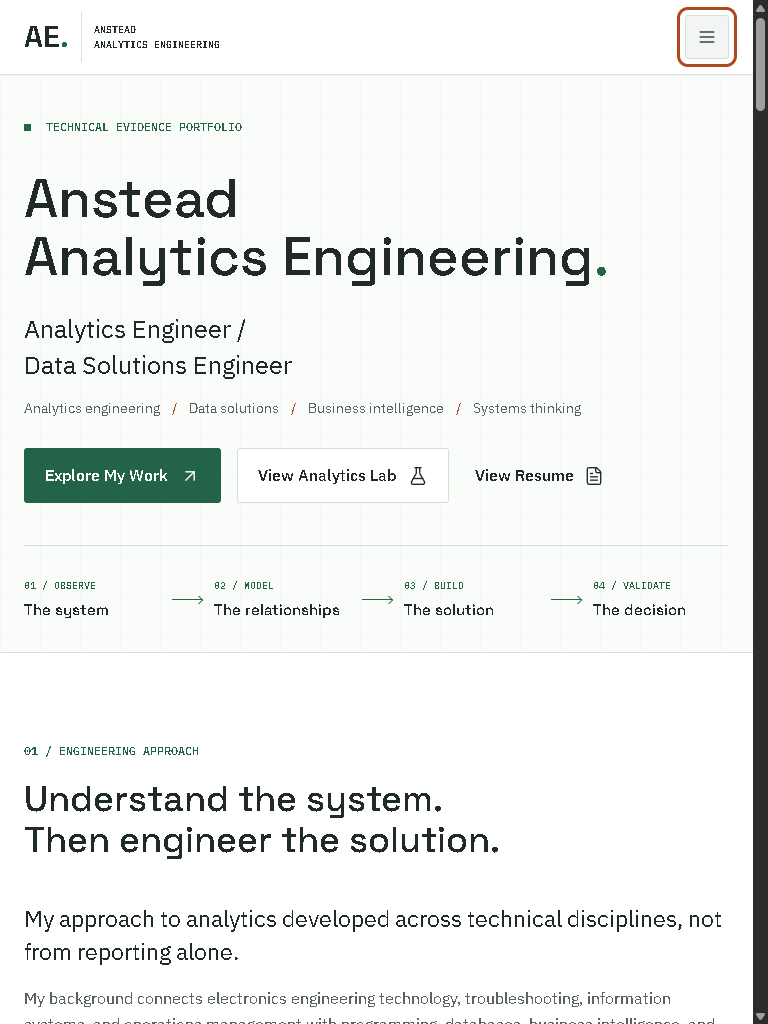
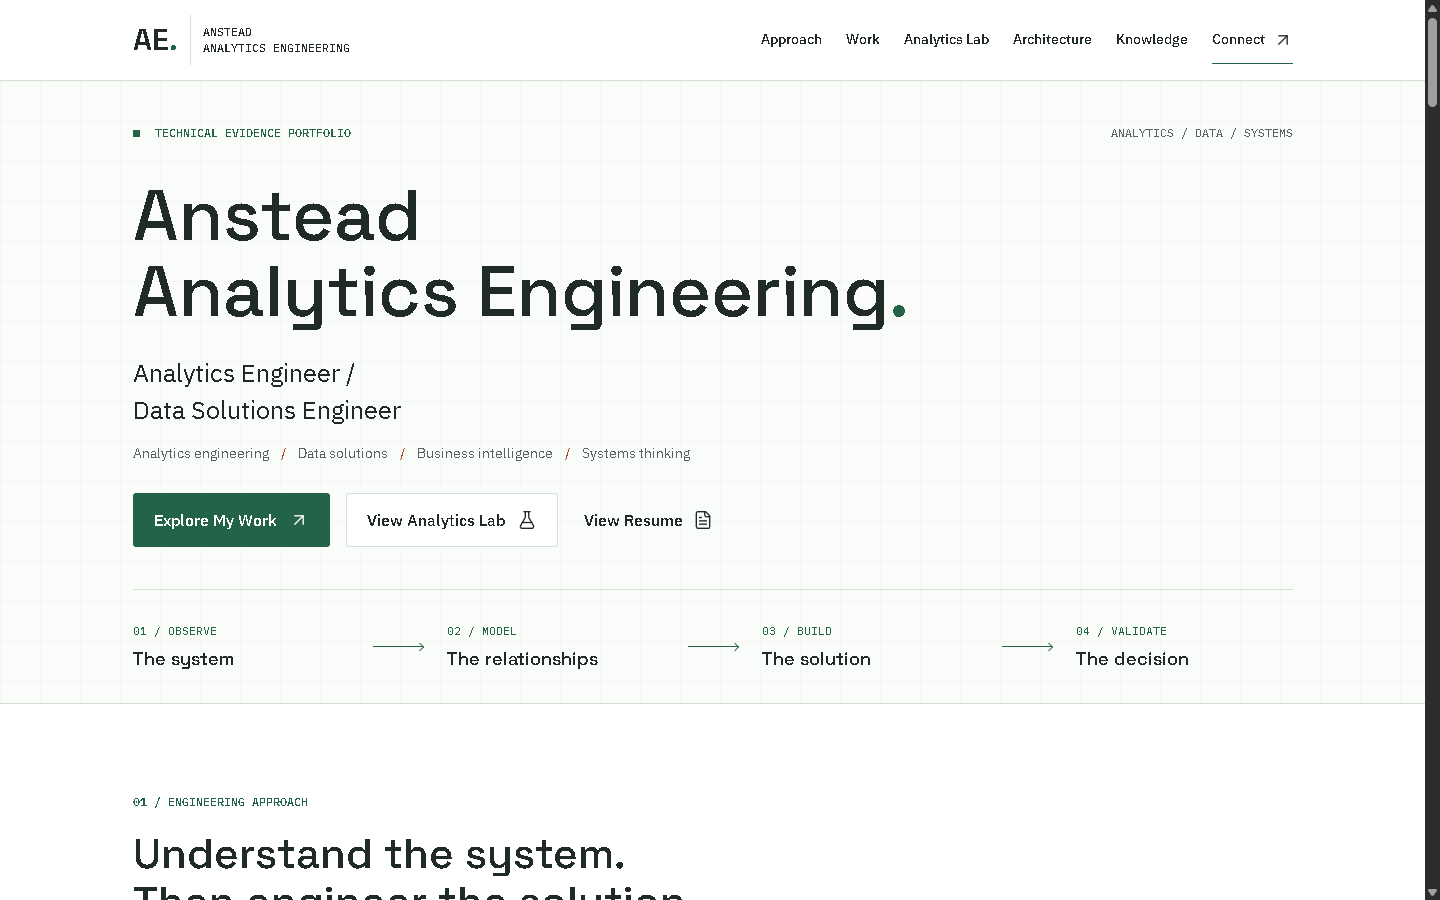
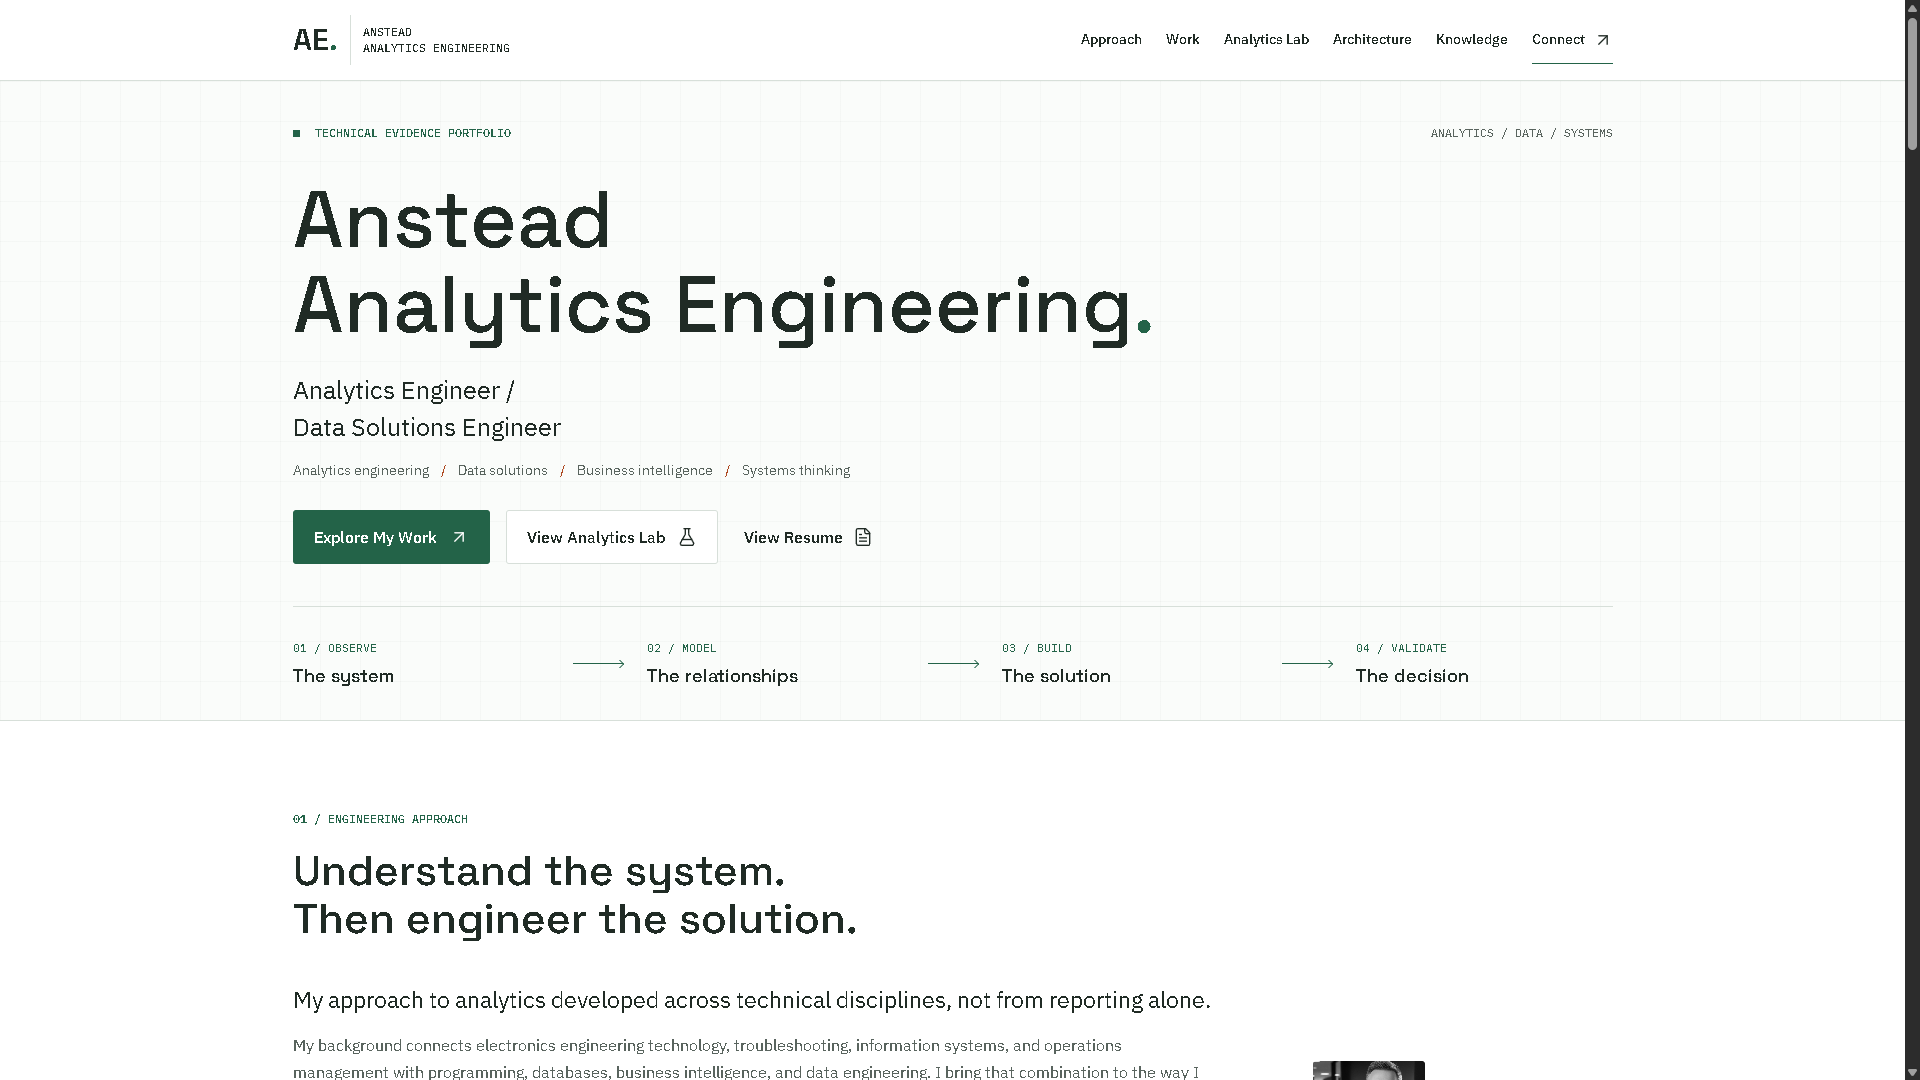
The retained run checked 375px, 768px, 1440px, and 1920px viewports. These reviewed page-only captures show the rendered homepage at those widths. They contain no browser chrome, local filesystem paths, credentials, or authenticated URLs. Images do not independently prove interaction correctness.
375px viewport
Historical rendered appearance at 375px; mobile menu closed after its keyboard test. Interaction results are separate.
768px viewport
Historical rendered appearance at 768px. The visible focus outline reflects a test state, not a layout defect.
1440px viewport
Historical desktop header and hero at 1440px. This capture proves appearance at capture time only.
1920px viewport
Historical wide-desktop appearance at 1920px; not evidence for untested devices or interactions.
Engineering decisions
Introduce an external browser observation/control boundary
Decision
Use the dedicated Chrome session and CDP for defined runtime checks.
Why
Implementation and deployment success did not sufficiently validate required browser interactions.
Alternatives considered
Continue manual inspection, retain the existing shared interaction path, or use DOM-only fallback checks.
Trade-off
Additional harness complexity and a debugging environment to maintain.
Validation / consequence
The retained CDP run recorded structured results for 16 checks and four viewports. The cause of the original shared-browser failures remains unproven.
Use observable state rather than fixed timing alone
Decision
Check load/font readiness, selected state, stable layout, focus, and fresh pointer hit targets.
Why
An observed rendered/interactable state is stronger evidence than assuming a delay was sufficient.
Alternatives considered
Rely primarily on fixed delays or repeat an input without new state observations.
Trade-off
More instrumentation, predicates, and maintenance of test assumptions.
Validation / consequence
Retained source shows state-aware settling and hit-testing. The final report records 15 changed snapshot hashes; its passing run did not exercise the extended-wait failure path.
Human + AI co-engineering
Human
Establishes goals, recognizes disconnects, defines constraints, changes investigation strategy, supplies environmental knowledge, evaluates evidence, and remains accountable for acceptance.
AI agent
Accelerates implementation, explores code, proposes changes, assists diagnosis, and produces repeatable automation. Its output is not proof of correctness or autonomous engineering authority.
Automation
Performs the defined checks and records observable results and repeatable evidence. A check result is limited by the assertion that produced it.
Runtime system
Determines actual rendered, interactive, and resource behavior. Proposed code and descriptions do not override that behavior.
Validation evidence
Shows whether defined acceptance checks passed. Observable behavior is the evidence used to evaluate the implementation; AI output alone is not that evidence.
What this demonstrates
Transferable reasoning, bounded claims
This specimen demonstrates systems thinking, brownfield adaptation, reverse engineering of an existing workflow, troubleshooting, instrumentation, automation, and runtime validation in an AI-assisted development process. The reasoning pattern can transfer to unfamiliar applications, reports, pipelines, models, and integrations. This case does not establish experience in technologies that were not used here.
Limitations / evidence boundary
What the retained evidence does not establish
The precise root cause of the original pointer failures, all original terminal error streams, complete historical failed-run snapshots, universal application correctness, and a real inherited Power BI repair are not independently established. Earlier outputs were sometimes overwritten or not retained.
Separate history from current regression
The metrics and screenshots above are fixed historical evidence. New Layer 4B regression runs are retained separately with their own timestamps and results. They do not replace or retroactively change this historical record.
Evidence provenance
Direct evidence includes three retained source revisions, the structured passing report, and reviewed viewport captures. Shared-browser difficulties and intermediate runtime diagnoses are retained accounts, not complete raw traces. Selected excerpts are shortened for presentation and explicitly labelled when extracted or reformatted.
Supporting evidence
Explore supporting evidence
Sanitized historical validation summary
Allowlisted counts, check names, viewport widths, source-file timestamp, and evidence qualifications. Raw reports, transcripts, local paths, launcher details, and account identifiers are excluded.